14. Generating Report Dashboard
Section titled “14. Generating Report Dashboard”JMeter supports dashboard report generation to get graphs and statistics from a test plan.
This chapter describes how to configure and use the generator.
14.1 Overview
Section titled “14.1 Overview”The dashboard generator is a modular extension of JMeter. Its default behavior is to read and process samples from CSV files to generate HTML files containing graph views. It can generate the report at end of a load test or on demand.
This report provides the following metrics:
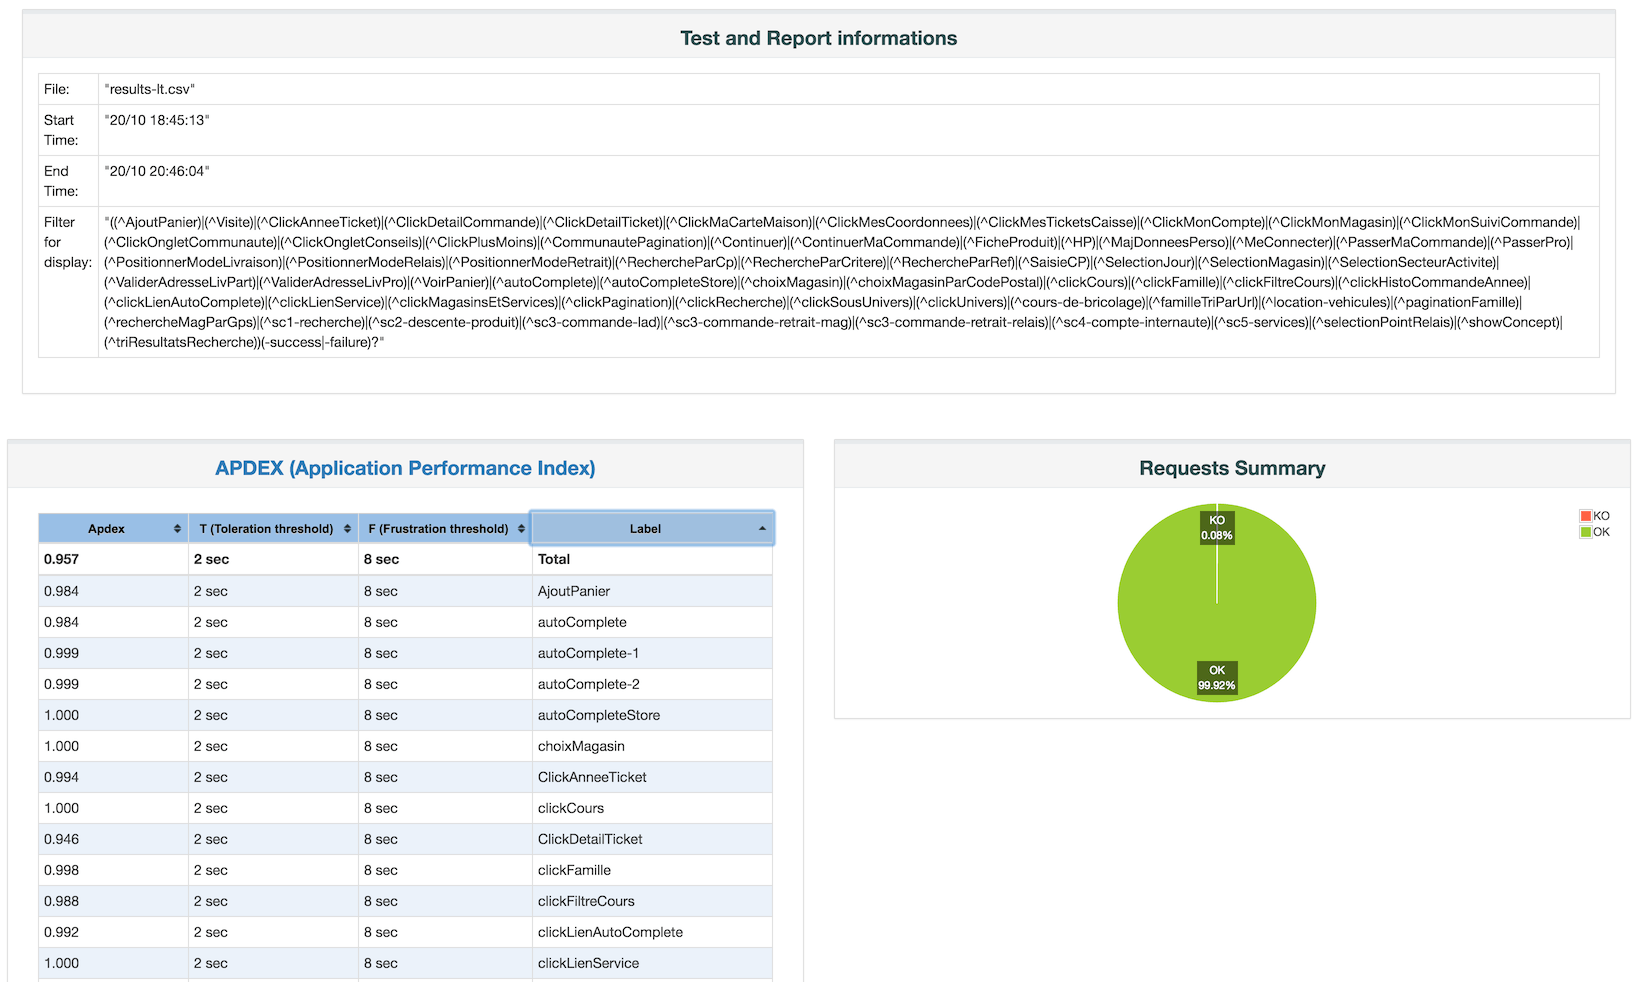
- APDEX (Application Performance Index) table that computes for every transaction the APDEX based on configurable values for tolerated and satisfied thresholds
- A request summary graph showing the Success and failed requests (Transaction Controller Sample Results are not taken into account) percentage:
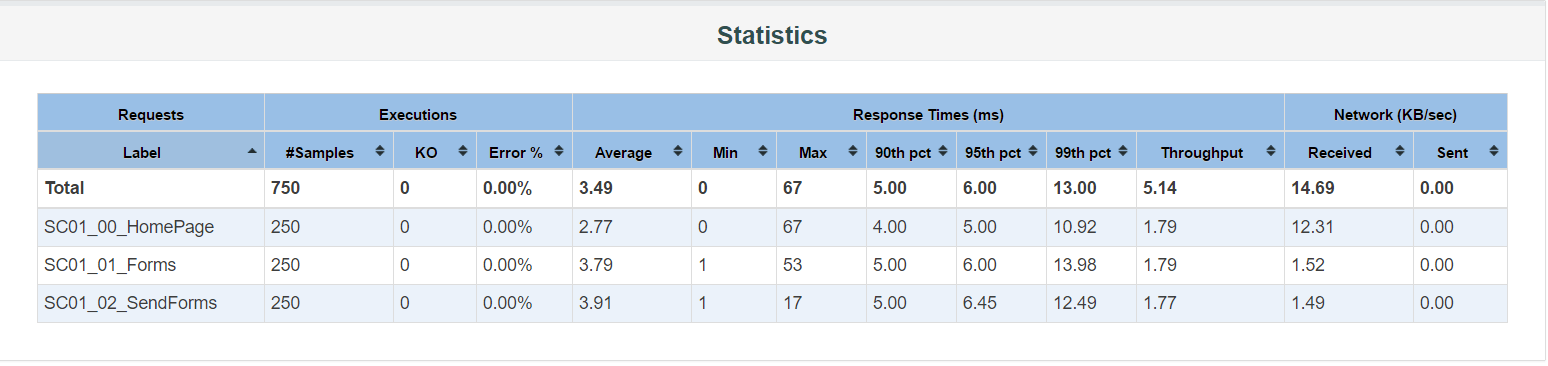
- A Statistics table providing in one table a summary of all metrics per transaction including 3 configurable percentiles:
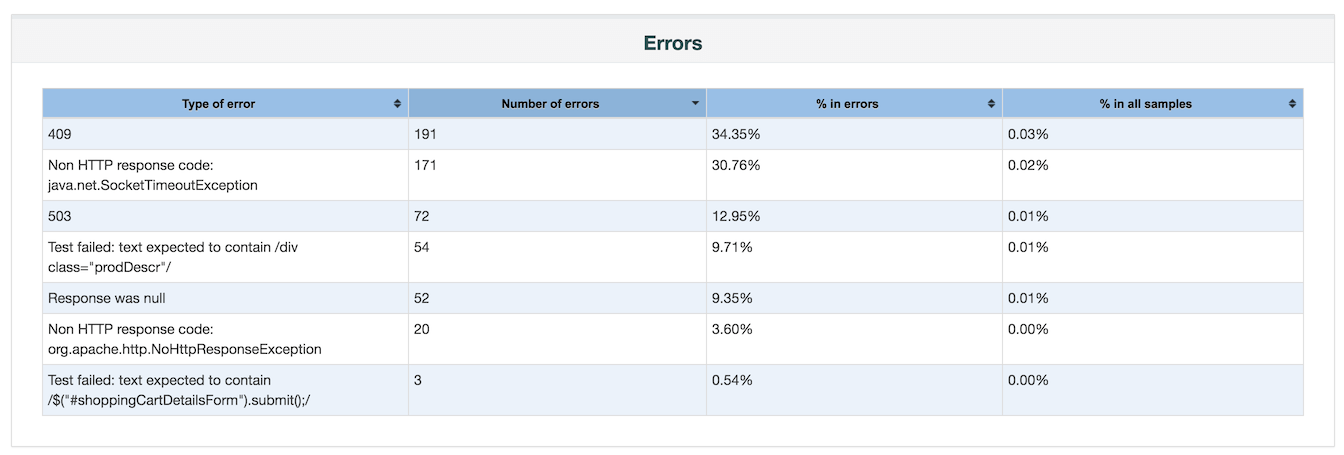
- An error table providing a summary of all errors and their proportion in the total requests:
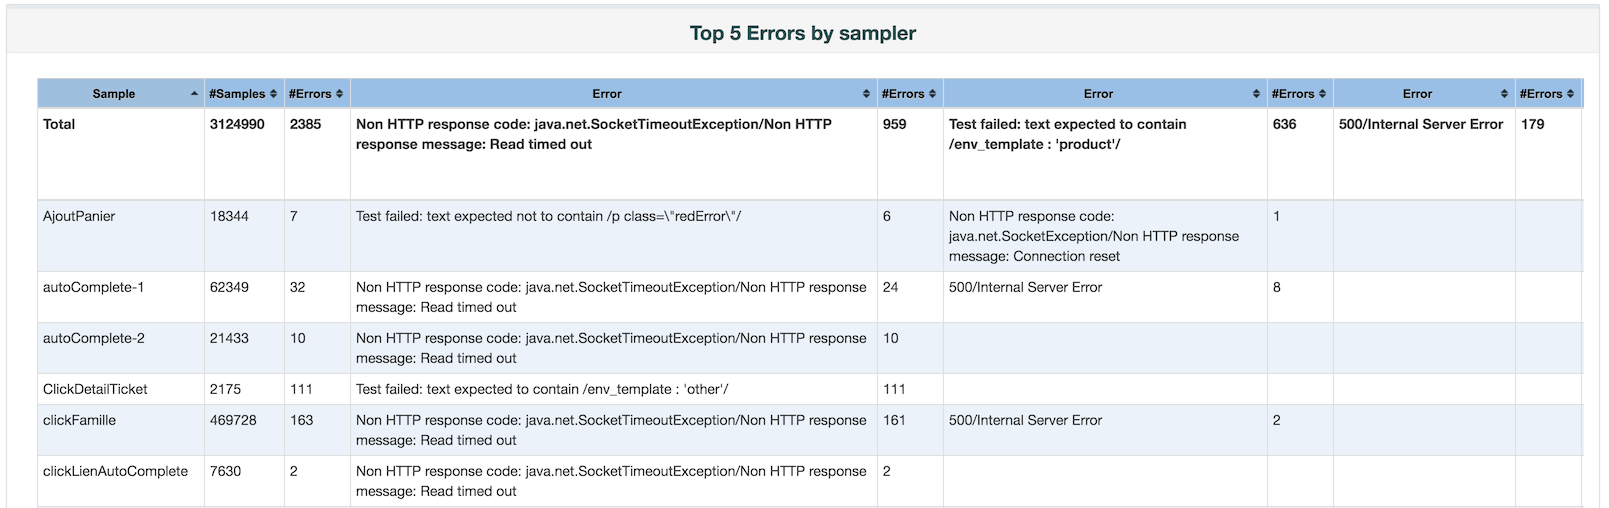
- A Top 5 Errors by Sampler table providing for every Sampler (excluding Transaction Controller by default) the top 5 Errors:
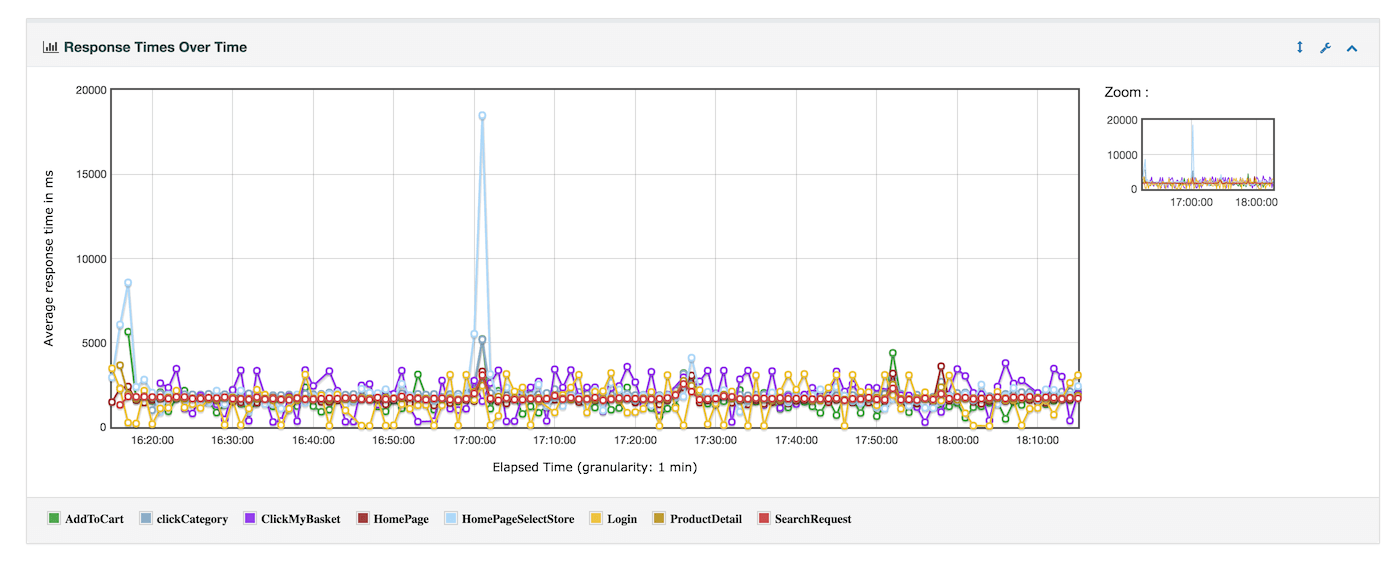
- Zoomable chart where you can check/uncheck every transaction to show/hide it for: - Response times Over Time (Includes Transaction Controller Sample Results):
 - Response times Percentiles Over Time (successful responses only):
 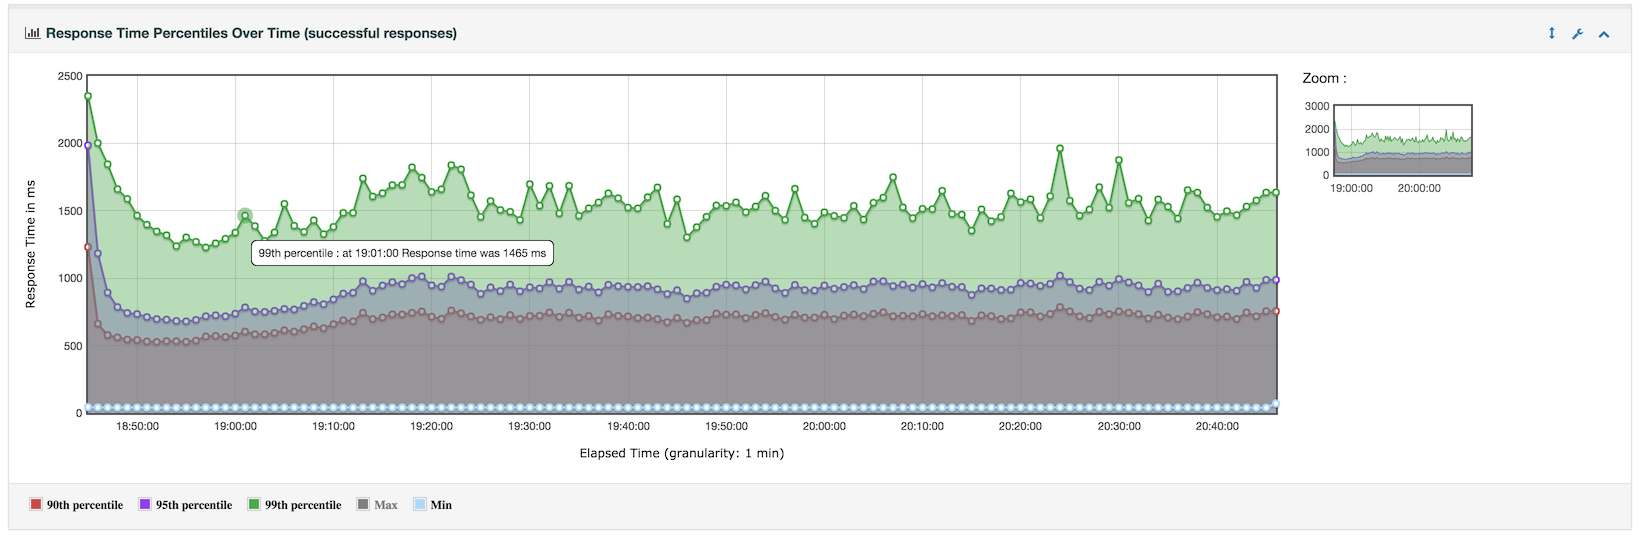 - Active Threads Over Time:
 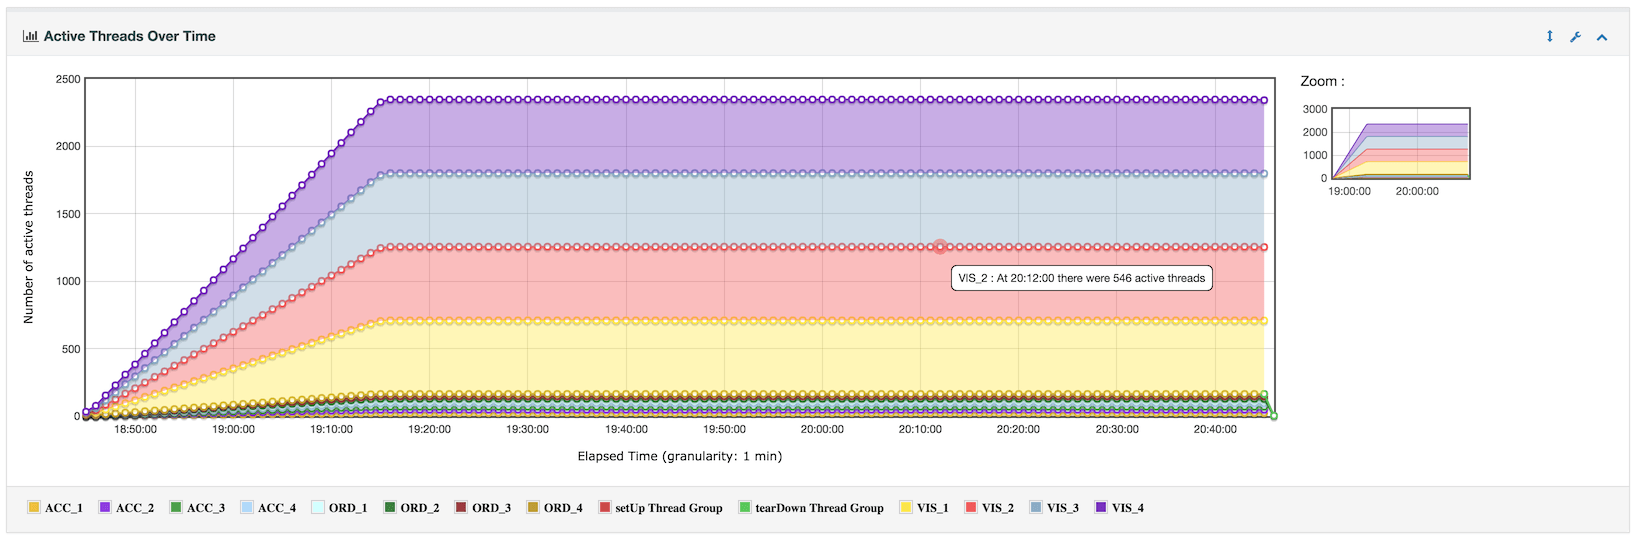 - Bytes throughput Over Time (Ignores Transaction Controller Sample Results):
 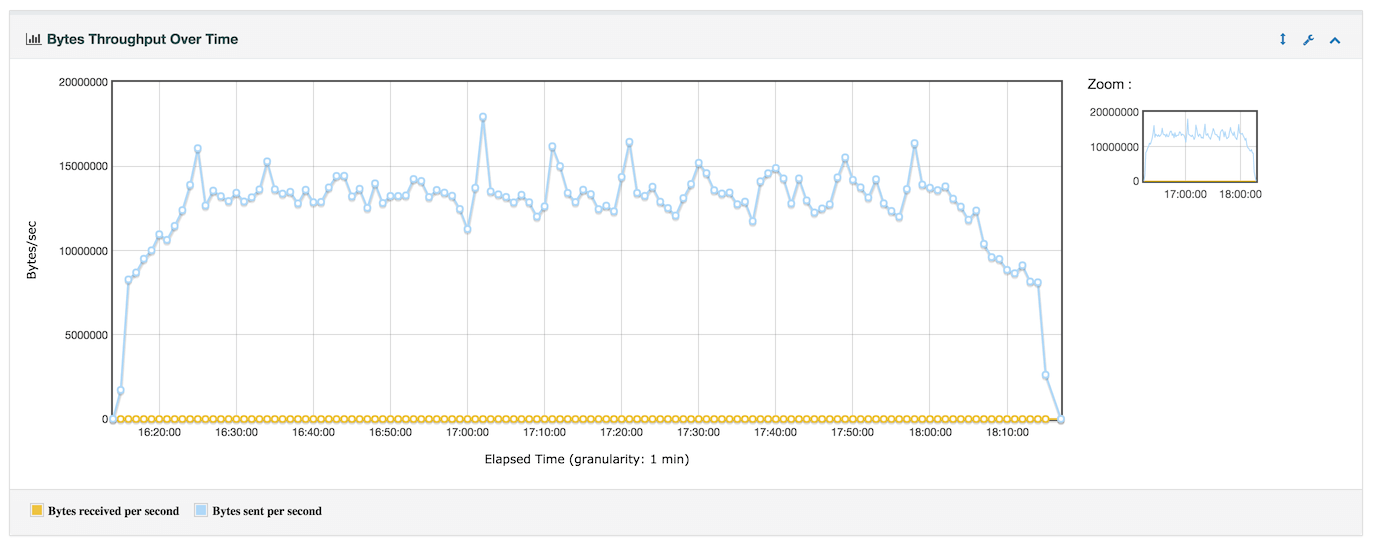 - Latencies Over Time (Includes Transaction Controller Sample Results):
 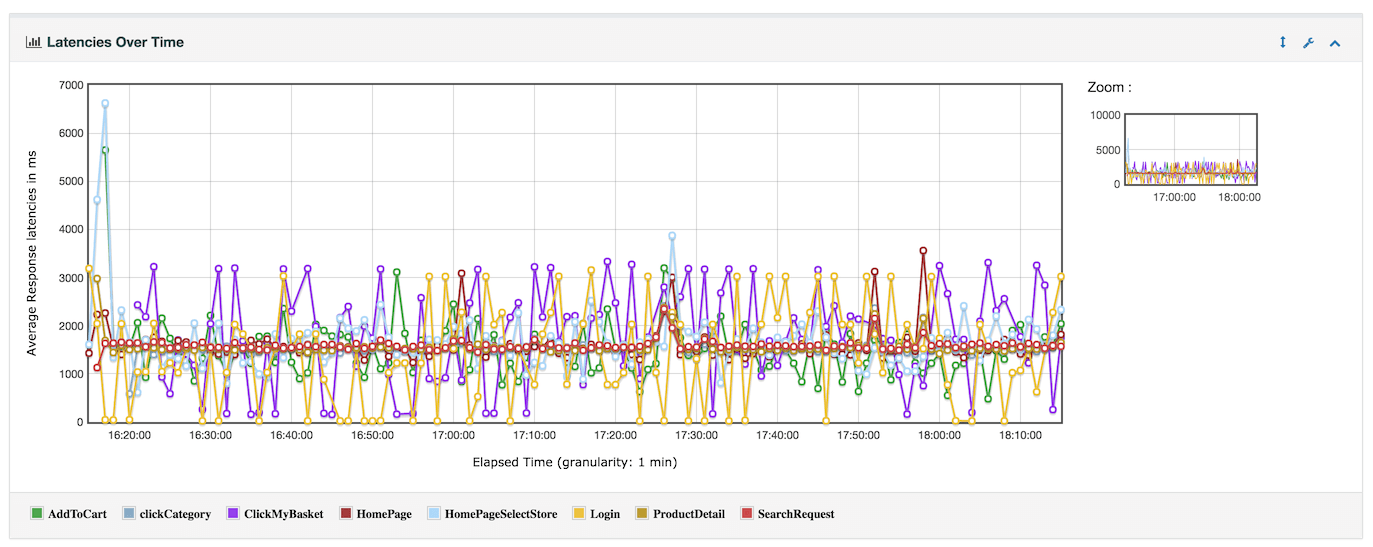 - Connect Time Over Time (Includes Transaction Controller Sample Results):
 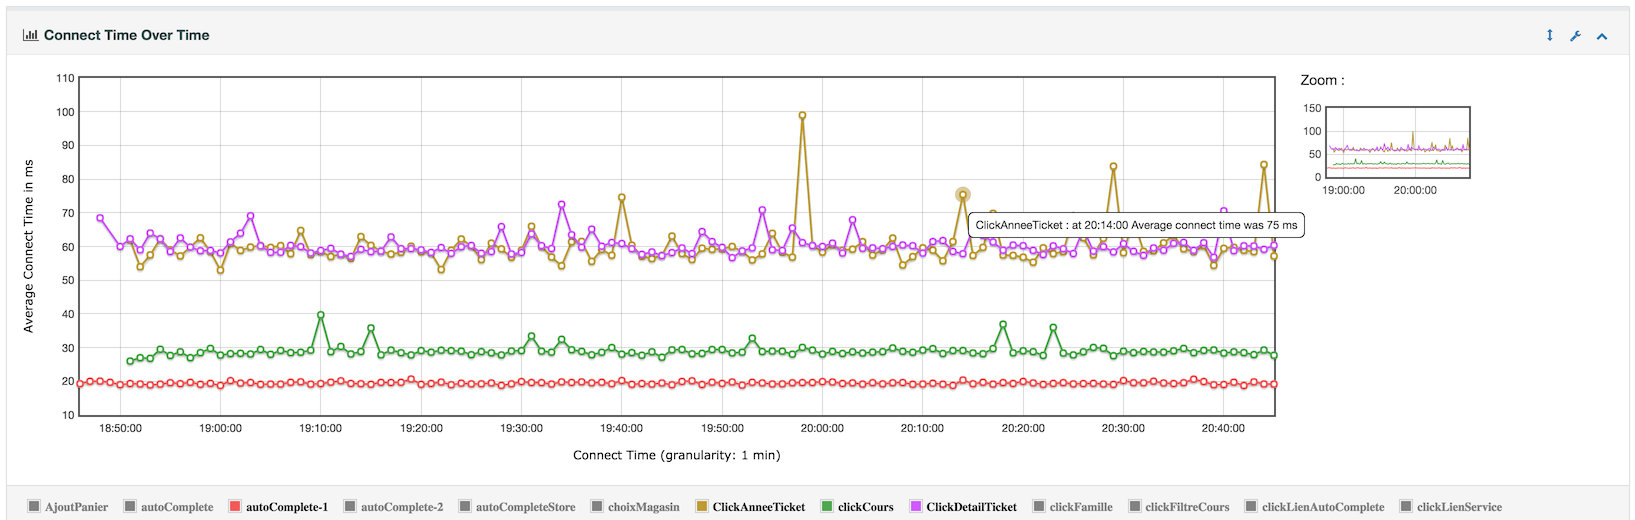 - Hits per second (Ignores Transaction Controller Sample Results):
 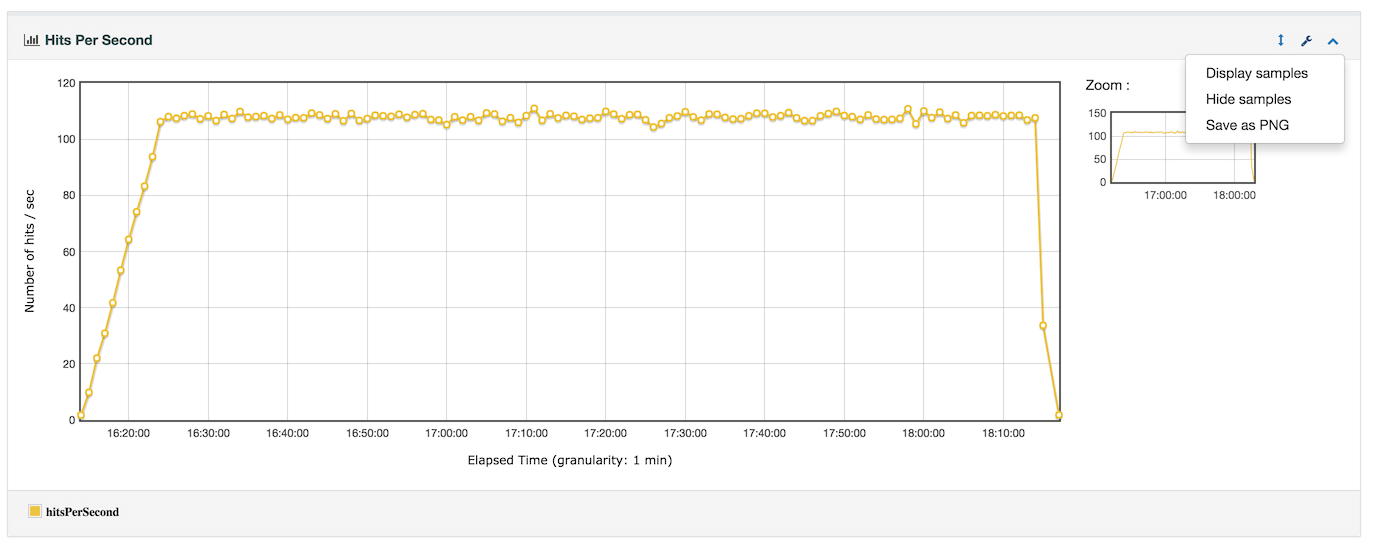 - Response codes per second (Ignores Transaction Controller Sample Results):
 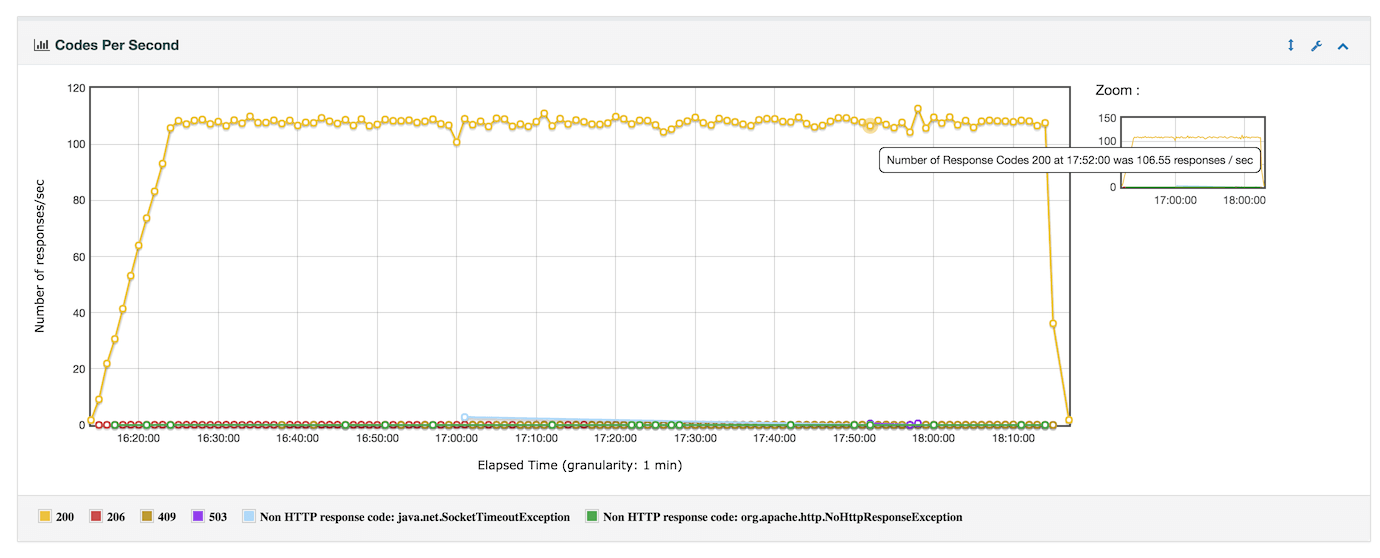 - Transactions per second (Includes Transaction Controller Sample Results):
 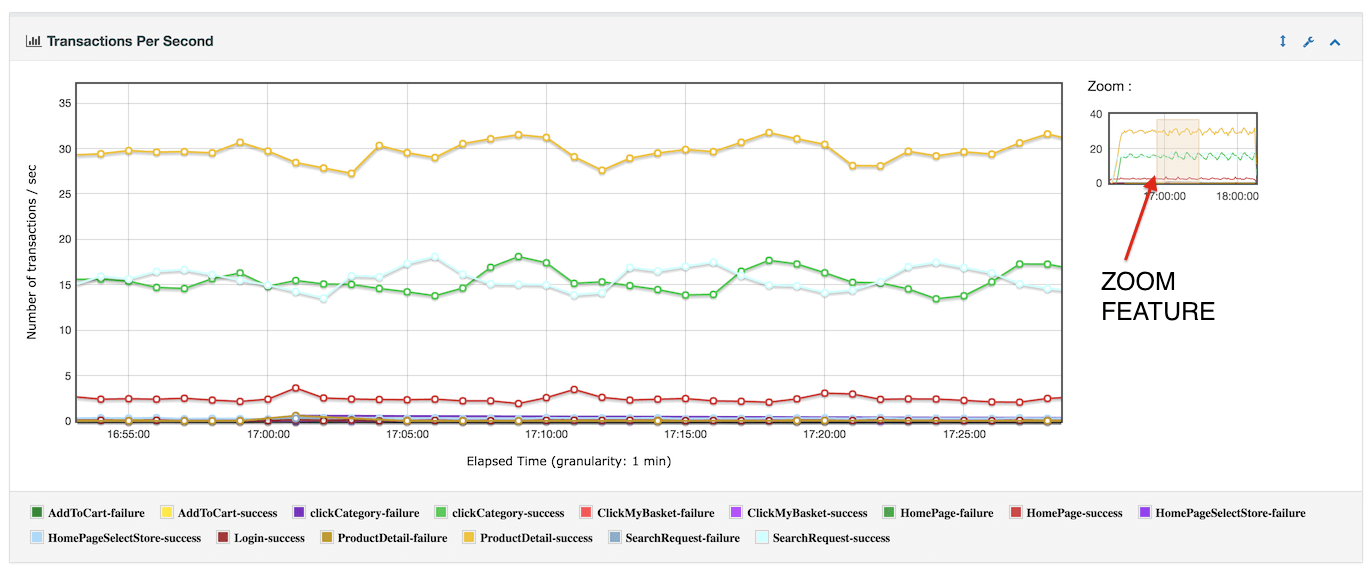 - Response Time vs Request per second (Ignores Transaction Controller Sample Results):
 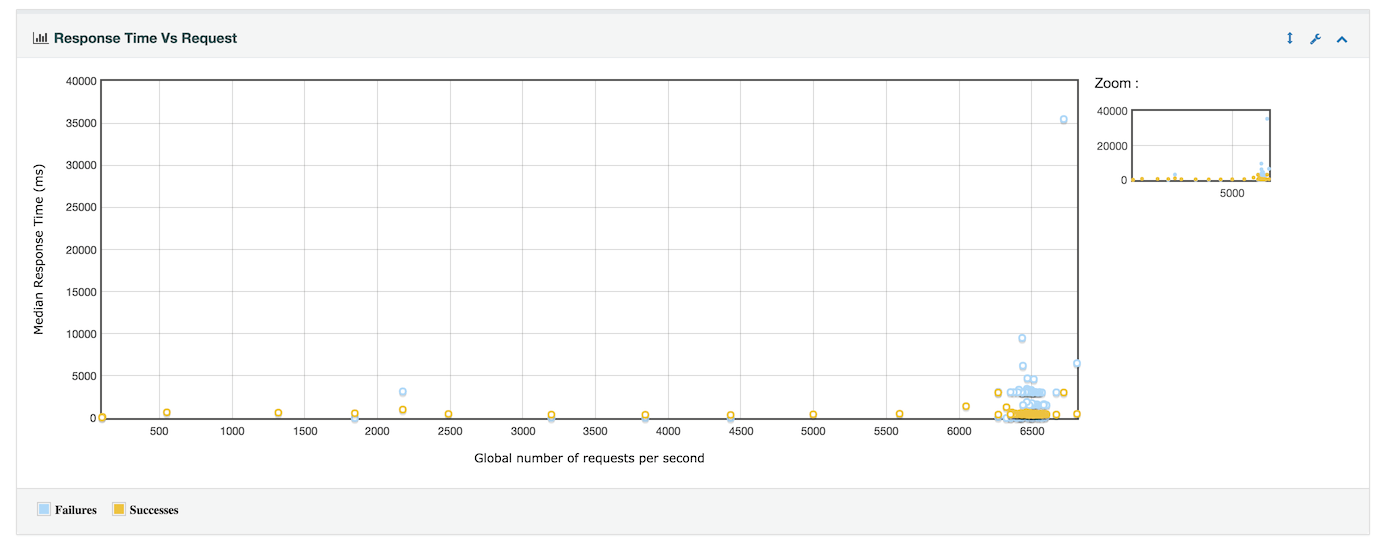 - Latency vs Request per second (Ignores Transaction Controller Sample Results):
 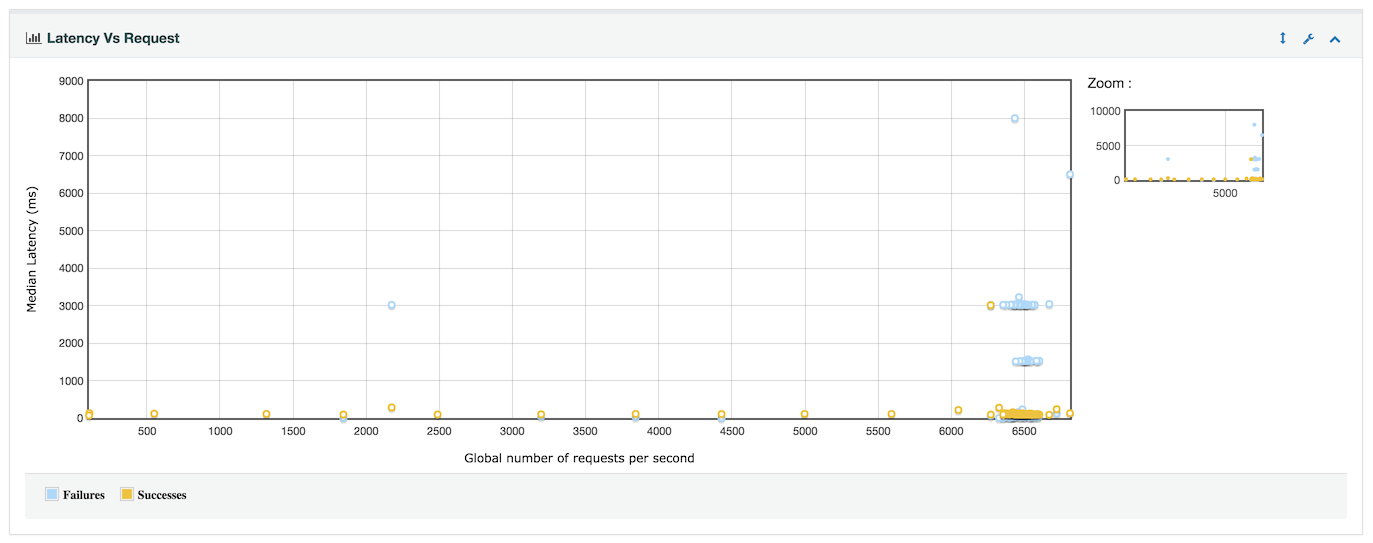 - Response time Overview (Excludes Transaction Controller Sample Results):
 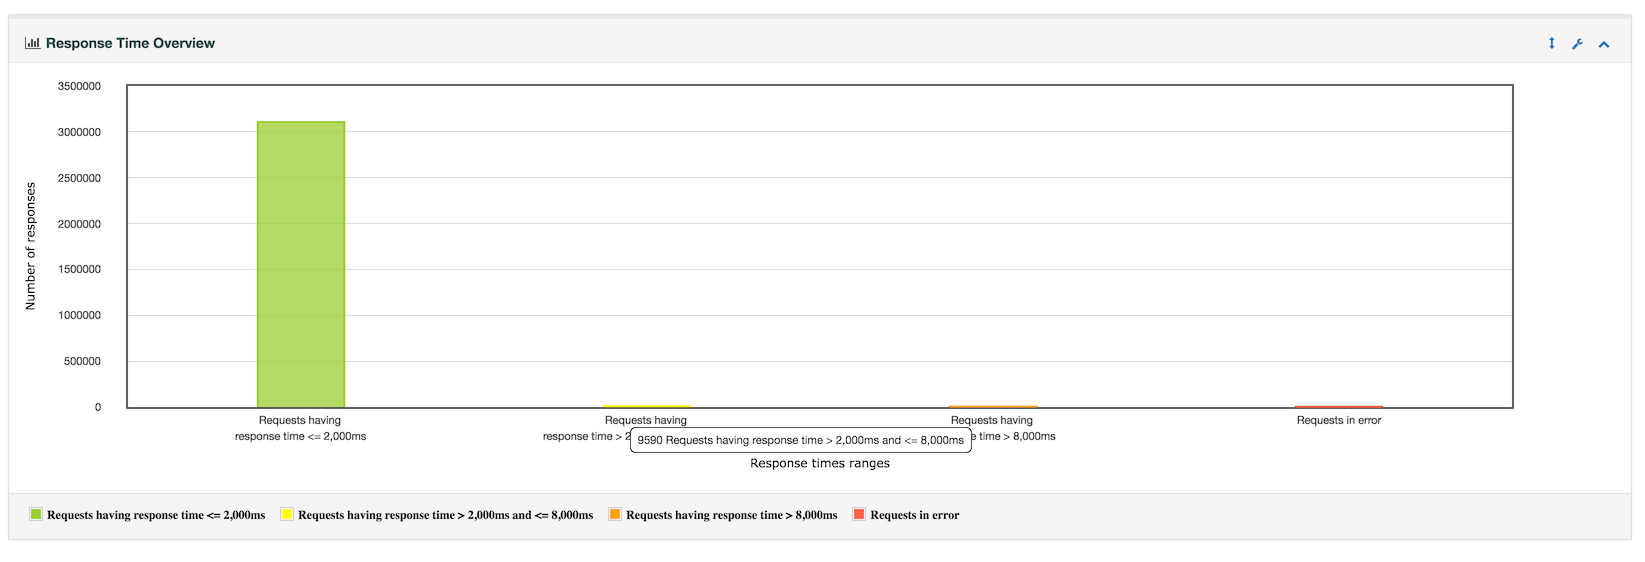 - Response times percentiles (Includes Transaction Controller Sample Results):
 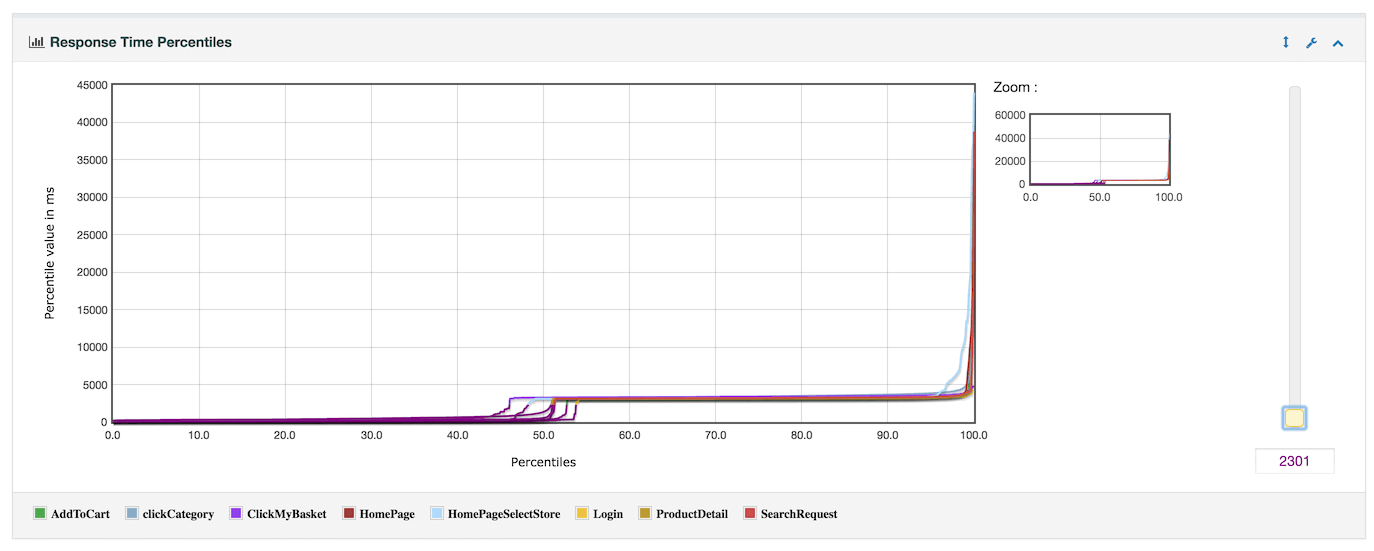 - Times vs Threads (Includes Transaction Controller Sample Results):
 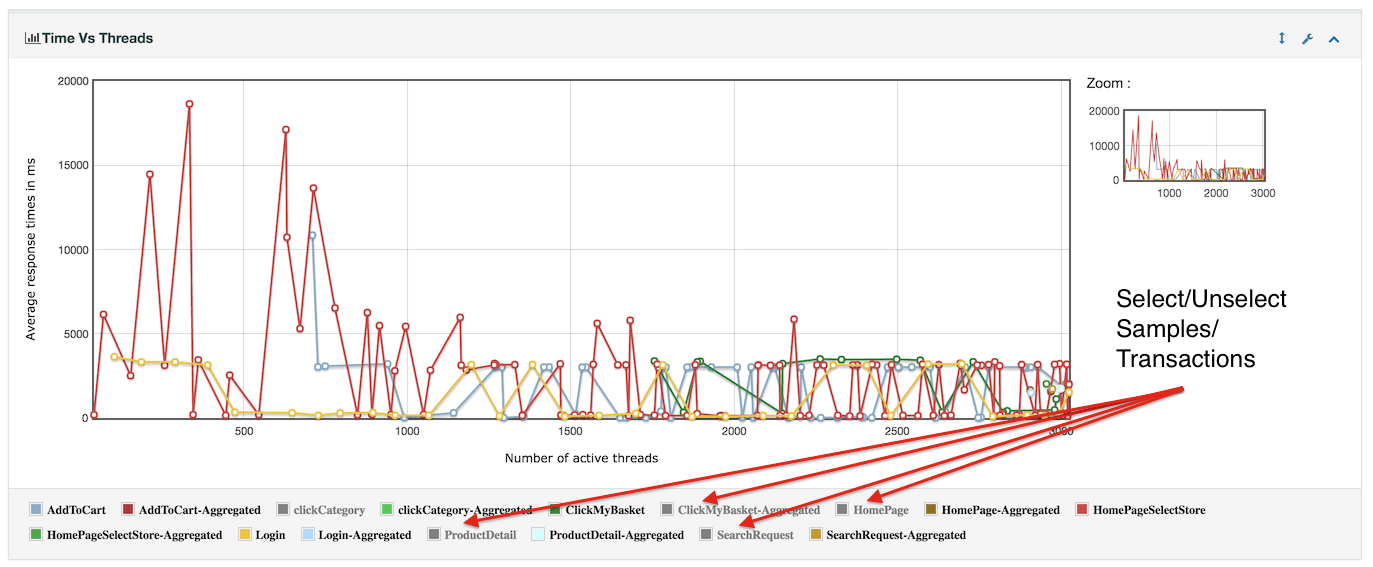 :::note In distributed mode, this graph shows a horizontal axis the number of threads for 1 server. It’s a current limitation ::: - Response Time Distribution (Includes Transaction Controller Sample Results):
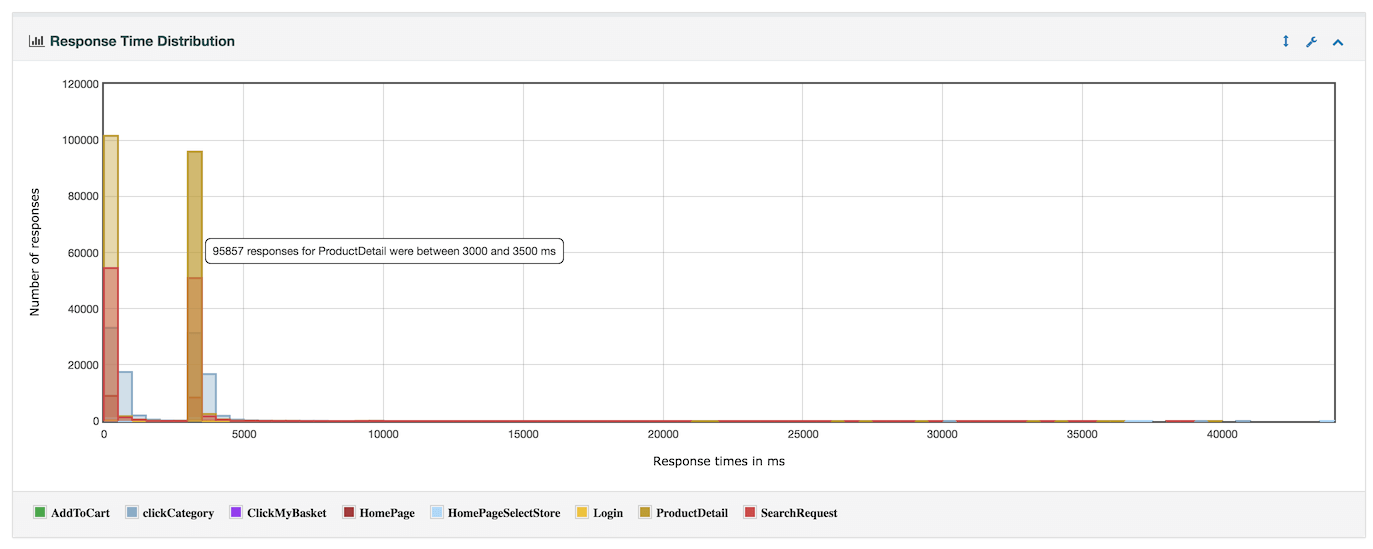
14.2 Configuring Dashboard Generation
Section titled “14.2 Configuring Dashboard Generation”Dashboard generation uses JMeter properties to customize the report. Some properties are used for general settings and others are used for a particular graph configuration or exporter configuration.
14.2.1 Requirements
Section titled “14.2.1 Requirements”14.2.1.1 Filtering configuration
Section titled “14.2.1.1 Filtering configuration”Ensure you set property jmeter.reportgenerator.exporter.html.series_filter to keep only the transactions
you want in the report if you don’t want everything.
In the example below you must only modify Search|Order, keep the rest:
jmeter.reportgenerator.exporter.html.series_filter=^(Search|Order)(-success|-failure)?$14.2.1.2 Save Service configuration
Section titled “14.2.1.2 Save Service configuration”To enable the generator to operate, the CSV file generated by JMeter must include certain required data which are correct by default in the last live version of JMeter.
If you modified those settings, check that your JMeter configuration follows these settings (these are the defaults):
jmeter.save.saveservice.bytes = true# Only available with HttpClient4#jmeter.save.saveservice.sent_bytes=truejmeter.save.saveservice.label = truejmeter.save.saveservice.latency = truejmeter.save.saveservice.response_code = truejmeter.save.saveservice.response_message = truejmeter.save.saveservice.successful = truejmeter.save.saveservice.thread_counts = truejmeter.save.saveservice.thread_name = truejmeter.save.saveservice.time = truejmeter.save.saveservice.connect_time = truejmeter.save.saveservice.assertion_results_failure_message = true# the timestamp format must include the time and should include the date.# For example the default, which is milliseconds since the epoch:jmeter.save.saveservice.timestamp_format = ms# Or the following would also be suitable# jmeter.save.saveservice.timestamp_format = yyyy/MM/dd HH:mm:ss14.2.1.3 Transaction Controller configuration
Section titled “14.2.1.3 Transaction Controller configuration”If you use Transaction Controllers, to ensure most accurate results:
- uncheck the box (this is the default configuration):
Generate parent sample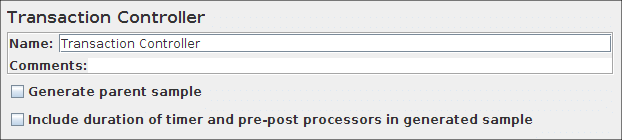
- If
Transaction Controlleris used as a Container to represent a request for an HTML Page that will trigger Ajax calls and you only want in your report the Transaction Controller, then Right click on the node and Apply Naming Policy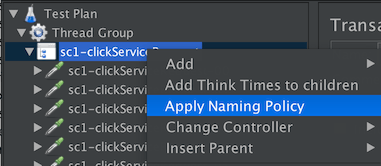 You will obtain this:
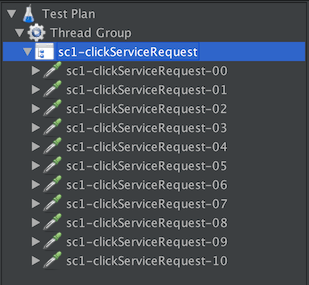
14.2.2 General settings
Section titled “14.2.2 General settings”| Name | Required | Description |
|---|---|---|
| report_title | No | Title used in the generated report. Default: “Apache JMeter Dashboard” |
| date_format | No | Default date format from SimpleDateFormat Java API with Locale.ENGLISH. Default Date format is yyyyMMddHHmmss Useful when you would like to generate a report after the load test, and the results file contains timestamp in another time zone. In this case the date format must include the time zone (zzz). :::note If jmeter.save.saveservice.timestamp_format does not contain year then use 1970 as year ::: Example: dd/MM/yyyy HH:mm:ss zzz |
| start_date | No | Start date of the range of data to use for report. Date format is defined by date_format property. Default: not filled which means data range will be used from the beginning |
| end_date | No | End date of the range of data to use for report. Date format is defined by date_format property. Default: not filled which means data range will be used until the end |
| overall_granularity | No | Granularity of over time graphs. Data is aggregated to have 1 minute ticks. :::note Granularity must be higher than 1 second (1000) otherwise throughput graphs will be incorrect ::: Default: “60000” (1 minute) |
| apdex_satisfied_threshold | No | Sets the satisfaction threshold for the APDEX calculation (in ms). Default: 500 |
| apdex_tolerated_threshold | No | Sets the tolerance threshold for the APDEX calculation (in ms). Default: 1500 |
| jmeter.reportgenerator.apdex_per_transaction | No | Sets satisfaction and tolerance threshold to specific samples. Use sample names or regular expression. Format is `sample_name:satisfaction |
| sample_filter | No | Sets the filter of samples to keep for generating graphs and statistics. An empty value deactivates the filtering. Format: Regular expression. Default: “” |
| temp_dir | No | Sets the temporary directory used by the generation process if it needs file I/O operations. Default: temp |
| statistic_window | No | Sets the size of the sliding window used by percentile evaluation. Caution: higher value provides a better accuracy but needs more memory. Default: 20000 |
14.2.3 Graph settings
Section titled “14.2.3 Graph settings”Each property describing a graph configuration must be prefixed with
jmeter.reportgenerator.graph.followed by the graph identifier.
14.2.3.1 General properties
Section titled “14.2.3.1 General properties”All graphs support these properties:
| Name | Required | Description |
|---|---|---|
| classname | Yes | The fully qualified class name of the graph The class of the graph must extend org.apache.jmeter.report.processor.graph.AbstractGraphConsumer. See Default graph section for more details. |
| exclude_controllers | No | Defines whether the graph discards controller samples. Default: false |
| title | No | Sets the title of the graph. Default: “” |
14.2.3.2 Specific properties
Section titled “14.2.3.2 Specific properties”Specific graph properties must use the prefix:
jmeter.reportgenerator.graph.<graph_id>.propertyThe name of the property will be mapped using camel case transformation and the matching method of the class will be called with the property value as argument.
E.g.:
jmeter.reportgenerator.graph.<graph_id>.property.set_granularity=150induces the call of the method setGranularity(150) on the
instance of the graph.
14.2.4 Export settings
Section titled “14.2.4 Export settings”Each property describing an exporter configuration must be prefixed with
jmeter.reportgenerator.exporterfollowed by the exporter identifier.
14.2.4.1 General properties
Section titled “14.2.4.1 General properties”All exporters support these properties:
| Name | Required | Description |
|---|---|---|
| classname | Yes | The fully qualified class name of the exporter The class of the exporter must implement org.apache.jmeter.report.dashboard.DataExporter . |
| filters_only_sample_series | No | Defines whether series_filter (see below) apply only on sample series. Default: true |
| series_filter | No | Sets the filter of series. An empty value deactivates the filtering. If not empty, regex should end with `(-success |
| show_controllers_only | No | Defines whether only controller series are shown. Default: false |
14.2.4.2 Specific properties
Section titled “14.2.4.2 Specific properties”Specific exporter properties must use the prefix
jmeter.reportgenerator.exporter.<exporter_id>.property| Name | Required | Description |
|---|---|---|
| output_dir | No | Sets the destination directory for generated html pages. Default: report-output |
| template_dir | No | Sets the source directory of template files from which the html pages are generated. Default: report-template |
14.2.4.3 Graph properties
Section titled “14.2.4.3 Graph properties”Graph properties allow exporters to overwrite some graph data.
They must use the prefix:
jmeter.reportgenerator.exporter.<exporter_id>.graph_options.<graph_id>| Name | Required | Description |
|---|---|---|
| minX | No | Sets the minimum abscissa for the graph. |
| maxX | No | Sets the maximum abscissa for the graph. |
| minY | No | Sets the minimum ordinate for the graph. |
| maxY | No | Sets the maximum ordinate for the graph. |
14.2.4.4 Filtering mechanisms
Section titled “14.2.4.4 Filtering mechanisms”Unlike the filtering in the section General properties which discards data before calculations, here the filtering is performed after the calculations and serves to simplify the final report.
The property series_filter
allows to filter which series of a graph (resp. rows of
a summary table) using regular expression that matches
the name of the series (resp. of the row).
However, even if the name of the
series (resp. row) matches the filter, the setting
of the other filtering properties can lead to its
discarding. Conversely if there is no matching, the
other properties can allow to keep it.
The following tables show how the setting of filtering properties works.
| filter_only_sample_series | Graph/Summary supports controllers discrimination | The current series is a controller series | show_controllers_only | Discarded |
|---|---|---|---|---|
| False | False | - | False | False |
| True | ||||
| - | False | |||
| True | ||||
| True | False | False | ||
| True | ||||
| True | False | |||
| True | ||||
| True | False | - | False | |
| True | ||||
| - | False | |||
| True | ||||
| True | False | False | ||
| True | True | |||
| True | False | False | ||
| True |
| filter_only_sample_series | Graph/Summary supports controllers discrimination | Kept |
|---|---|---|
| False | False | False |
| True | ||
| True | False | True |
| True | False |
14.2.5 Sample configuration
Section titled “14.2.5 Sample configuration”You can copy the following configuration to your user.properties file in order to test the report generator.
# Configure this property to change the report title#jmeter.reportgenerator.report_title=Apache JMeter Dashboard
# Change this parameter if you want to change the granularity of over time graphs.# Granularity must be higher than 1000 (1second) otherwise Throughput graphs will be incorrect# see Bug 60149#jmeter.reportgenerator.overall_granularity=60000
 Change this parameter if you want to change the granularity of Response time distribution# Set to 100 ms by default#jmeter.reportgenerator.graph.responseTimeDistribution.property.set_granularity=100
# Change this parameter if you want to override the APDEX satisfaction threshold.jmeter.reportgenerator.apdex_satisfied_threshold=1500
# Change this parameter if you want to override the APDEX tolerance threshold.jmeter.reportgenerator.apdex_tolerated_threshold=3000
# Sets the destination directory for generated html pages, it is better to change it for every generation# This will override the value set through -o command line option# jmeter.reportgenerator.exporter.html.property.output_dir=/tmp/test-report
# Indicates which graph series are filtered (regular expression)# In the below example we filter on Search and Order samples# Note that the end of the pattern should always include (-success|-failure)?$# Transactions per second suffixes Transactions with "-success" or "-failure" depending# on the result#jmeter.reportgenerator.exporter.html.series_filter=^(Search|Order)(-success|-failure)?$
# Indicates whether series filter apply only on sample seriesjmeter.reportgenerator.exporter.html.filters_only_sample_series=trueThis configuration allows to generate a report where:
- Over time graphs have a time granularity equal to 1 minute.
- The satisfaction threshold for ADPEX calculation is 1 second and half.
- The tolerance threshold for ADPEX calculation is 3 seconds.
- The HTML files are generated in the directory
/tmp/test-report. - Only series which the name begins with “
s0” or “s1” are shown. - The previous filter only applies to graphs (resp. summary tables) where the series (resp. rows) match samples
14.3 Generating reports
Section titled “14.3 Generating reports”The report generation can be done as a stand alone process from a sample log file or automatically after running load test.
14.3.1 Generation from an existing sample CSV log file
Section titled “14.3.1 Generation from an existing sample CSV log file”Use the following command:
jmeter -g <log file> -o <Path to output folder>14.3.2 Generation after load test
Section titled “14.3.2 Generation after load test”Use the following command:
jmeter -n -t <test JMX file> -l <test log file> -e -o <Path to output folder>14.3.3 Generation using GUI Tools menu
Section titled “14.3.3 Generation using GUI Tools menu”You can generate the HTML report using menu item Tools → Generate HTML report:
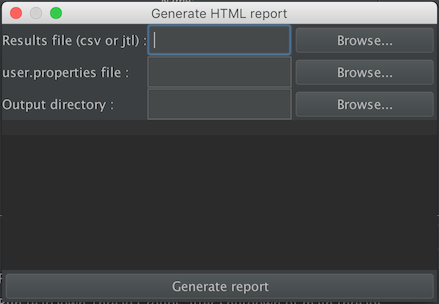 Figure 14.1. HTML Report Dialog Menu
For each parameters see the following table :
| Name | Required | Description |
|---|---|---|
| Results file (csv or jtl) | Yes | The CSV output of a tes run |
| user.properties file | Yes | The user.properties file used to run the load test |
| Output directory | No | The directory where you want the report to be created(must be empty) |
If no output directory is defined, the controller will use \${JMETER_HOME}/bin/report-output.
You then only have to click on the Generate report button and wait for an information dialog to appear
14.4 Default graphs
Section titled “14.4 Default graphs”All graphs provided by this report engine are located in the
package
org.apache.jmeter.report.processor.graph.impl
The dashboard generator provides the following graph classes:
| Graph | Description | Supports controller discrimination |
|---|---|---|
| ActiveThreadsGraphConsumer | This graph represents the number of active threads over time. | False |
| BytesThroughputGraphConsumer | This graph represents the throughput of received and sent data over time. | False |
| CodesPerSecondGraphConsumer | This graph represents the rate of response codes over time. | False |
| HitsPerSecondGraphConsumer | This graph represents the rate of finished requests over time. | False |
| LatencyOverTimeGraphConsumer | This graph represents the average latency time over time. | True |
| ConnectTimeOverTimeGraphConsumer | This graph represents the connection time over time. | True |
| LatencyVSRequestGraphConsumer | This graph represents the median and average latency time depending on the number of current requests. | False |
| ResponseTimeDistributionGraphConsumer | This graph represents the distribution of the samples depending on their elapsed time and name. | True |
| ResponseTimeOverTimeGraphConsumer | This graph represents the average response time over time. | True |
| ResponseTimePercentilesGraphConsumer | This graph represents the percentiles of the elapsed time over time. | True |
| ResponseTimePercentilesOverTimeGraphConsumer | This graph shows Min/Max and 3 percentiles response time over time. | True |
| ResponseTimeVSRequestGraphConsumer | This graph represents the median and average response time depending on the number of current requests. | False |
| TimeVSThreadGraphConsumer | This graph represents the average response time depending on the number of current active threads. The *-aggregated series represent the average response time regardless of the number of current active threads. These series are represented by a sole point because the number of current active threads is aggregated to an average. So for these points: - The abscissa is the average of the number of current active threads when samples of the series finish. - The ordinate is the average of the response time for the samples of the series regardless of the number of current active threads. | True |
| TransactionsPerSecondGraphConsumer | This graph represents the rate of transaction by sample name over time. | True |
14.5 Generating customs graphs over time
Section titled “14.5 Generating customs graphs over time”You can graph any sample_variable in CSV over time, you can customize your graphs by settings their properties in the user.properties file.
They must use the id prefix custom_:
jmeter.reportgenerator.graph.custom_<your_graph_name_id>.property.<your_option_name>To specify that this graph is a customized one :
jmeter.reportgenerator.graph.custom_<your_graph_name_id>.classname=org.apache.jmeter.report.processor.graph.impl.CustomGraphConsumer| Name | Required | Description |
|---|---|---|
| set_X_Axis | Yes | Sets the X axis name of the graph. |
| set_Y_Axis | Yes | Sets the Y axis name of the graph. |
| set_Content_Message | Yes | Sets the displayed message when the cursor is on a point of the graph. |
| set_Sample_Variable_Name | Yes | Name of the column you want to graph in the csv. |
Here is an example of a custom graph configuration that graphs the variable ts-hit:
jmeter.reportgenerator.graph.custom_testGraph.classname=org.apache.jmeter.report.processor.graph.impl.CustomGraphConsumerjmeter.reportgenerator.graph.custom_testGraph.title=Chunk Hitjmeter.reportgenerator.graph.custom_testGraph.property.set_Y_Axis=Number of Hitsjmeter.reportgenerator.graph.custom_testGraph.set_X_Axis=Over Timejmeter.reportgenerator.graph.custom_testGraph.property.set_granularity=60000jmeter.reportgenerator.graph.custom_testGraph.property.set_Sample_Variable_Name=ts-hitjmeter.reportgenerator.graph.custom_testGraph.property.set_Content_Message=Number of Hits :14.6 Want to improve Report Dashboard ?
Section titled “14.6 Want to improve Report Dashboard ?”If you want to contribute new graphs or improve current ones, you can read this developer documentation.
Read this documentation on contributing.