

Configure the JMeter Aggregate Report listeners: properties, defaults, and practical usage notes for building reliable load tests.
Part of the Listeners category. Also documented in context in the full Component Reference.
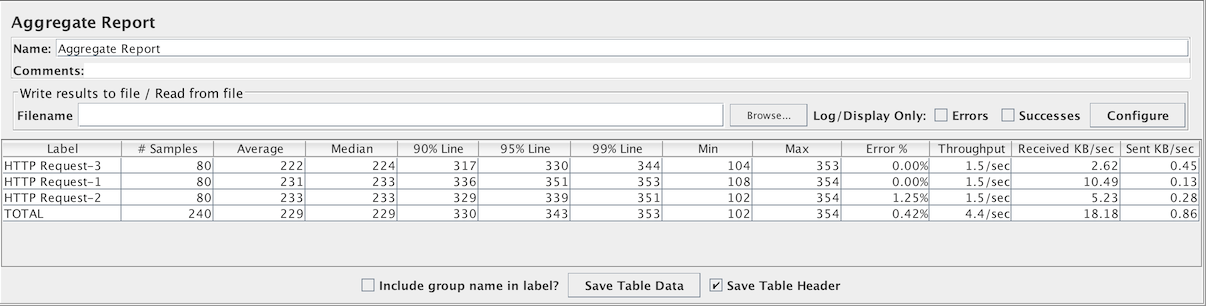
The aggregate report creates a table row for each differently named request in your test. For each request, it totals the response information and provides request count, min, max, average, error rate, approximate throughput (request/second) and Kilobytes per second throughput. Once the test is done, the throughput is the actual through for the duration of the entire test.
The throughput is calculated from the point of view of the sampler target (e.g. the remote server in the case of HTTP samples). JMeter takes into account the total time over which the requests have been generated. If other samplers and timers are in the same thread, these will increase the total time, and therefore reduce the throughput value. So two identical samplers with different names will have half the throughput of two samplers with the same name. It is important to choose the sampler names correctly to get the best results from the Aggregate Report.
Calculation of the Median and 90 % Line (90th percentile) values requires additional memory. JMeter now combines samples with the same elapsed time, so far less memory is used. However, for samples that take more than a few seconds, the probability is that fewer samples will have identical times, in which case more memory will be needed. Note you can use this listener afterwards to reload a CSV or XML results file which is the recommended way to avoid performance impacts. See the Summary Report for a similar Listener that does not store individual samples and so needs constant memory.
Label- The label of the sample. If “Include group name in label” is selected, then the name of the thread group is added as a prefix. This allows identical labels from different thread groups to be collated separately if required.# Samples- The number of samples with the same labelAverage- The average time of a set of resultsMedian- The median is the time in the middle of a set of results. 50 % of the samples took no more than this time; the remainder took at least as long.90% Line- 90 % of the samples took no more than this time. The remaining samples took at least as long as this. (90th percentile)95% Line- 95 % of the samples took no more than this time. The remaining samples took at least as long as this. (95th percentile)99% Line- 99 % of the samples took no more than this time. The remaining samples took at least as long as this. (99th percentile)Min- The shortest time for the samples with the same label- Max - The longest time for the samples with the same label
Error %- Percent of requests with errorsThroughput- the Throughput is measured in requests per second/minute/hour. The time unit is chosen so that the displayed rate is at least 1.0. When the throughput is saved to a CSV file, it is expressed in requests/second, i.e. 30.0 requests/minute is saved as 0.5.Received KB/sec- The throughput measured in received Kilobytes per secondSent KB/sec- The throughput measured in sent Kilobytes per second
Times are in milliseconds.
The figure below shows an example of selecting the “Include group name” checkbox.
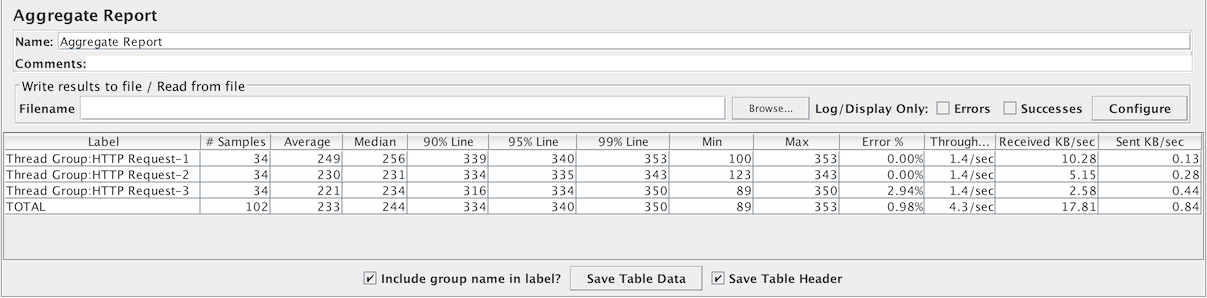 Sample “
Include group name” display