

Configure the JMeter Backend Listener listeners: properties, defaults, and practical usage notes for building reliable load tests.
Part of the Listeners category. Also documented in context in the full Component Reference.
TL;DR: the Backend Listener streams live sample results to an external time-series backend (InfluxDB, Graphite, Elasticsearch, Prometheus via a bridge) during the run, so you can watch a real-time dashboard instead of waiting for the test to finish and parsing a .jtl file.
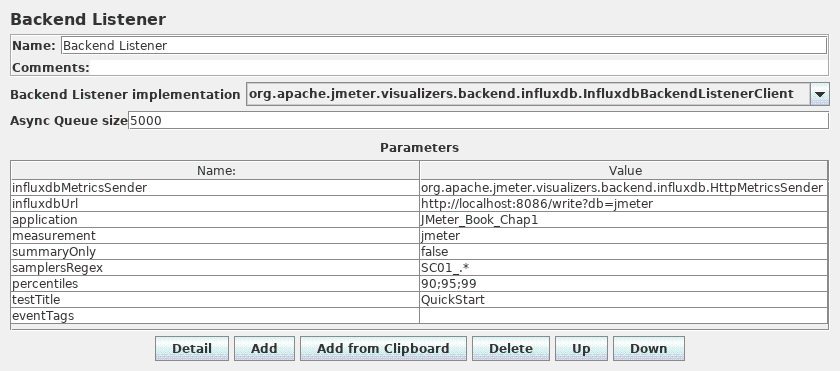
The backend listener is an Asynchronous listener that enables you to plug custom implementations of BackendListenerClient. By default, a Graphite implementation is provided.
| Name | Required | Description |
|---|---|---|
| Name | Yes | Descriptive name for this element that is shown in the tree. |
| Backend Listener implementation | Yes | Class of the BackendListenerClient implementation. |
| Async Queue size | Yes | Size of the queue that holds the SampleResults while they are processed asynchronously. |
| Parameters | Yes | Parameters of the BackendListenerClient implementation. |
The following parameters apply to the GraphiteBackendListenerClient implementation:
| Name | Required | Description |
|---|---|---|
| graphiteMetricsSender | Yes | org.apache.jmeter.visualizers.backend.graphite.TextGraphiteMetricsSender or org.apache.jmeter.visualizers.backend.graphite.PickleGraphiteMetricsSender |
| graphiteHost | Yes | Graphite or InfluxDB (with Graphite plugin enabled) server host |
| graphitePort | Yes | Graphite or InfluxDB (with Graphite plugin enabled) server port, defaults to 2003. Note PickleGraphiteMetricsSender (port 2004) can only talk to Graphite server. |
| rootMetricsPrefix | Yes | Prefix of metrics sent to backend. Defaults to “jmeter.” Note that JMeter does not add a separator between the root prefix and the samplerName which is why the trailing dot is currently needed. |
| summaryOnly | Yes | Only send a summary with no detail. Defaults to true. |
| samplersList | Yes | Defines the names (labels) of sample results to be sent to the back end. If useRegexpForSamplersList=false this is a list of semi-colon separated names. If useRegexpForSamplersList=true this is a regular expression which will be matched against the names. |
| useRegexpForSamplersList | Yes | Consider samplersList as a regular expression to select the samplers for which you want to report metrics to backend. Defaults to false. |
| percentiles | Yes | The percentiles you want to send to the backend. A percentile may contain a fractional part, for example 12.5. (The separator is always ”.”) List must be semicolon separated. Generally 3 or 4 values should be sufficient. |
See also Real-time results for more details.
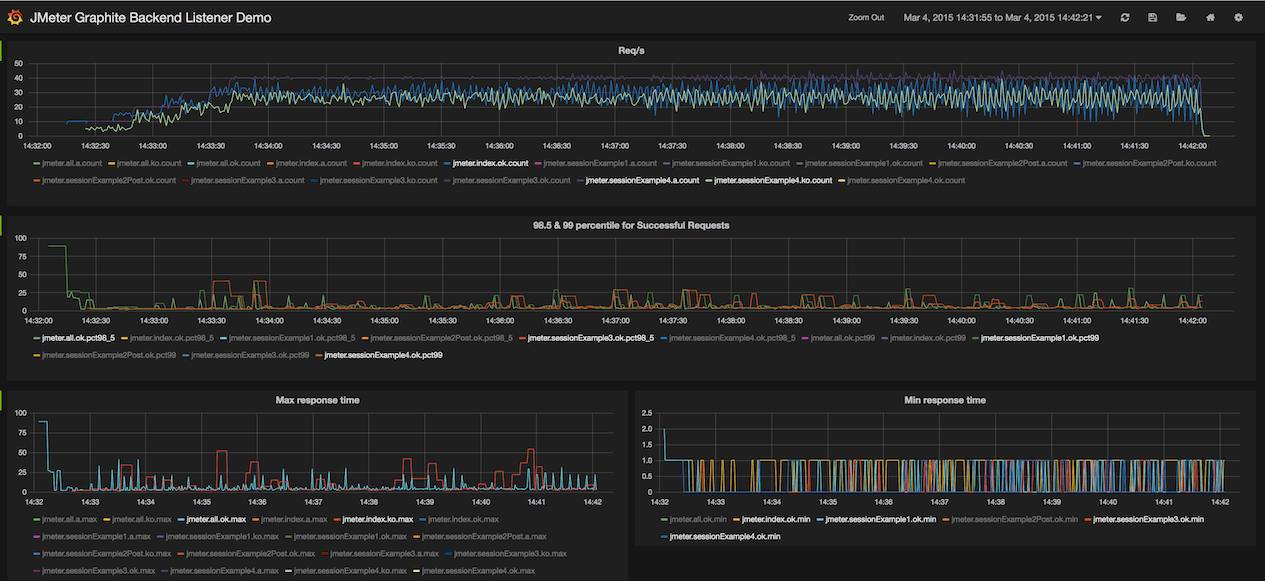 Grafana dashboard
Since JMeter 3.2, an implementation that allows writing directly in InfluxDB with a custom schema.
It is called InfluxdbBackendListenerClient. The following parameters apply to the
InfluxdbBackendListenerClient implementation:
| Name | Required | Description |
|---|---|---|
| influxdbMetricsSender | Yes | org.apache.jmeter.visualizers.backend.influxdb.HttpMetricsSender |
| influxdbUrl | Yes | Influx URL (example: http://influxHost:8086/write?db=jmeter) |
| influxdbToken | No | InfluxDB 2 authentication token (example: HE9yIdAPzWJDspH_tCc2UvdKZpX==); since 5.2. |
| application | Yes | Name of tested application. This value is stored in the ‘events’ measurement as a tag named ‘application’ |
| measurement | Yes | Measurement as per Influx Line Protocol Reference. Defaults to “jmeter”. |
| summaryOnly | Yes | Only send a summary with no detail. Defaults to true. |
| samplersRegex | Yes | Regular expression which will be matched against the names of samples and sent to the back end. |
| testTitle | Yes | Test name. Defaults to Test name. This value is stored in the ‘events’ measurement as a field named ‘text’. JMeter generate automatically at the start and the end of the test an annotation with this value ending with ’ started’ and ’ ended’ |
| eventTags | No | Grafana allow to display tag for each annotation. You can fill them here. This value is stored in the ‘events’ measurement as a tag named ‘tags’. |
| percentiles | Yes | The percentiles you want to send to the backend. A percentile may contain a fractional part, for example 12.5 (The separator is always “.”). List must be semicolon separated. Generally three or four values should be sufficient. |
| TAG_WhatEverYouWant | No | You can add as many custom tags as you want. For each of them, create a new line and prefix its name by “TAG_” |
See also Real-time results and Influxdb annotations in Grafana for more details. There is also a subsection on configuring the listener for InfluxDB v2.
Since JMeter 5.4, an implementation that writes all sample results to InfluxDB.
It is called InfluxDBRawBackendListenerClient.
It is worth noting that this will use more resources than the
InfluxdbBackendListenerClient, both by JMeter and InfluxDB
due to the increase in data and individual writes.
The following parameters apply to the
InfluxDBRawBackendListenerClient
implementation:
| Name | Required | Description |
|---|---|---|
| influxdbMetricsSender | Yes | org.apache.jmeter.visualizers.backend.influxdb.HttpMetricsSender |
| influxdbUrl | Yes | Influx URL (e.g. http://influxHost:8086/write?db=jmeter or, for the cloud, https://eu-central-1-1.aws.cloud2.influxdata.com/api/v2/write?org=org-id&bucket=jmeter) |
| influxdbToken | No | InfluxDB 2 authentication token (e.g. HE9yIdAPzWJDspH_tCc2UvdKZpX==) |
| measurement | Yes | Measurement as per Influx Line Protocol Reference. Defaults to “jmeter.” |
Common gotchas
Section titled “Common gotchas”- It runs asynchronously in a queue — under very high throughput, an undersized queue can drop metrics rather than block the test; increase
async.queue.sizeif you see gaps in the dashboard that don’t match the actual run. - This is the right tool for live observability; it doesn’t replace the standard
.jtlresults file or the HTML Dashboard Report for post-run analysis and archiving. - Configuration (URL, database/bucket, application name tag) is backend-specific — see Grafana / InfluxDB / Backend Listener for a working setup.
- Adds CPU/network overhead on the injector itself; on already-saturated load generators, consider a lighter listener or sampling instead.